Cadia GMD Stator: Observed Behaviour and Modelling
The Stator Behaviour
The Cadia SAG mill diameter is 40 ft and the ring motor that drives the mill is rated at 20 MW. In 1998 when the mill and motor were commissioned both were the largest machines of their type in the world.
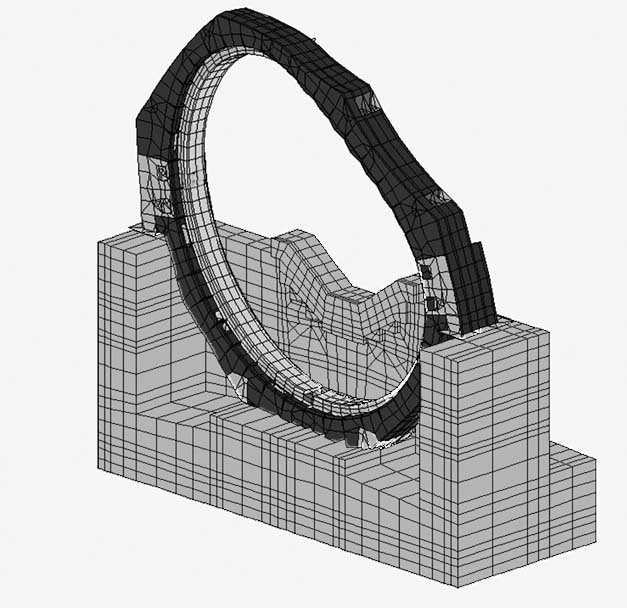
The stator exhibited vibration excursions that appeared to be related to the mill speed. We determined the mode shape of the vibration using approximately 25 accelerometers around the circumference of the stator and found it was a pure, in-plane motion as represented in Figure 1. The frequency of the vibration was approximately 7 Hz and it occurred then the motor reached a speed at which the pole-passing frequency was 14 Hz. The amplitude of the vibration was approximately 300 mm/s at the top of the stator horizontally.
The source of the 7 Hz vibration was not evident as the finite element model of the stator developed by Siemens during the design of the motor indicated that the natural frequency of the stator in the first in-plane mode should have been approximately 12 Hz. We measured the modal frequencies of the stator using an impact hammer when the motor was de-energised and found that the frequency of the first in-plane mode was approximately 9.5 Hz. Whilst this result did not explain the 7 Hz vibration, it did show that the material properties that Siemens used in their analysis of the stator were incorrect. In particular, the effective stiffness of the core was much less than had been assumed. We then developed a separate finite element (FE) model of the stator that included a lower stiffness for the core and tuned it to the measured frequencies (Figure 1). This FE model was used to assess possible causes of the lower than expected vibration frequency and was also used to assess potential modifications to repair the stator.
The modelling and the repair of the stator are described in [1]. A stiffener or “Strongback” was added to the stator to raise its natural frequency from 9.5 to 10.7 Hz. The vibrations were eliminated. The Strongback was sized to provide a separation between the operating natural frequency and half the pole-passing frequency of at least 3 Hz. This separation equals the increase in natural frequency produced by the temporary wedges (or chocks) that were installed under the stator to control the vibration plus a safety factor (see Preface and [1]). The Strongback reduced the static deflections in the stator by more than 80%. Two pins were also added to each of the stator supports to prevent any lateral movement. Since then, the stator has performed very well.
Origin of the 7 Hz Vibration
Whilst the solution to the vibration was relatively straight forward once the behaviour or mode shape was understood, the origin of the 7 Hz vibration was not determined from the measurements or during the development of the Strongback. The FE model of the stator that was tuned to the vibration and modal measurements taken on site showed that the natural frequency of the stator would be greater than 8 Hz even if the stator core stiffness was reduced to zero. Furthermore, it was observed during site tests that the vibration amplitude did not vary with speed as it would be expected to if the vibration were a resonance phenomenon. Also, the amplitude was bounded and independent of speed once the vibration initiated.
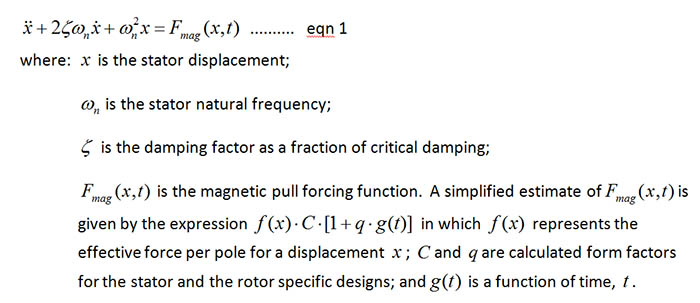
The equations of motion of the stator can be expressed as:
Equation 1 is general and can be used to assess both Siemens and ABB stators for nonlinear vibration. There is no analytical solution to the equation, so it must be solved numerically. The solutions to mathematical equations of this sort are generally presented as stability maps. In this case, the map would be a plot of the natural frequency against q and lines would be drawn on the diagram to represent the boundaries of stable and unstable (large) vibration. However, stability diagrams are of little use in motor design as the natural frequency and q are fixed. It is sufficient to use direct numerical solvers to determine the solution, i.e., the vibration amplitude and frequency.
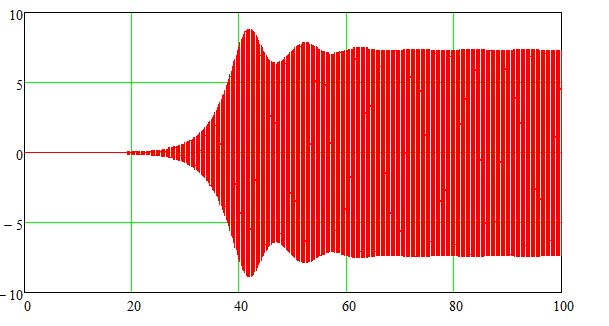
The numerical solution of equation 1 for the Cadia stator is shown in Figure 2. When the operating frequency ω is set to the pole passing frequency of 14 Hz (equivalent to speed at which the vibrations occurred) the model predicts that the stator will initially operate normally with very low vibration amplitude but then the amplitude will begin to increase exponentially and reach a new stable state with an amplitude of approximately 7 mm. This is consistent with the measurements from site. The large amplitude vibration will not occur if the pole-passing frequency is increased or decreased by 5% indicating that this is not a linear resonance phenomenon. Furthermore, the amplitude of the vibration does not grow beyond 7 mm. This is because the nonlinear magnetic pull curve that initially generates the excitation of the stator also damps the vibration once the deflection reaches a certain level in a vibration cycle [2].
Assessment of New Motors
Equation 1 can be used to assess any new motor design. The magnetic pull curve defines the function f(x). The form factors C and q can be determined from a finite element analysis of the stator, however, C requires calibration against a new machine as the magnetic pull curve provided by vendors for design are too conservative. We determine the these form factors against measurements from the Cadia stator for Siemens motors and the Antamina stator for ABB motors . This calibration process means that any change made to the way a new stator is modelled must also be made to the reference models of the Cadia and Antamina stators to ensure consistency. One such change that has occurred since c.2000 when the Cadia model was first developed is the way in which Siemens calculate the magnetic pull curve. Siemens now include electrical damping in the calculation of the magnetic pull curves for new motors and this results in lower magnetic pull forces per pole than the method they used in the original Cadia design.
The terms in equation 1 can be made more accurate by including more information from the finite element analysis of the stator in the form factors C and q but this is generally only be required in detailed design or design checks. A simpler screening approach can be used for preliminary assessments of new designs. The numerical analysis of equation 1 yields the interesting result that sub-harmonic vibrations will only occur if the magnetic pull is sufficient to reduce the operating natural frequency of the stator to approximately half the pole-passing frequency. This fact can be used to assess stator designs relatively simply as a first pass. It is important to note however that impact hammer tests on the Cadia stator during operation resulted in measured natural frequencies at least 15% greater than the half-pole-passing frequency, so the simple screening approach should only be used for preliminary analysis.
Next Post: Other Investigations of the Cadia Vibrations
References:
[1] Meimaris, C., Lai, W. K. K. L., Cox, L., 2001. Remedial design of the world’s largest SAG mill gearless drive. In Proceedings of the SAG 2001 Conference, Vancouver, Canada.
[2] Rand, R. H., Lecture notes on nonlinear vibrations. Cornell University, 2014.